 Orvus
OrvusWhat are the 4 P's of competitor analysis?
December 10, 2025
What the 4 Ps reveal about rivals - and why a repeatable competitor analysis framework matters
The competitor analysis framework built on the four classic marketing Ps - Product, Price, Place, Promotion - is less academic checklist and more practical toolkit. It answers a simple operational question: if you could peer inside a rival’s product page, checkout flow, and ad account, what would you change in your business this week? You can’t literally do that, but you can approximate it. This framework helps you turn public signals into testable hypotheses and measurable experiments.
Start with a sharp compass
Use the competitor analysis framework as your compass: it keeps you focused on what matters to customers and to your metrics. The four Ps are diagnostic lenses. They let you ask better, narrower questions: what does the competitor claim, what is the true economic offer, where do they sell, and how do they convert attention into customers? These questions generate work that product, growth, and operations teams can actually do.

How the competitor analysis framework maps to the 4 Ps
The phrase competitor analysis framework is here for a reason: you need a repeatable way to convert observation into tests. Product maps to features and narrative; Price uncovers visible and hidden economics; Place identifies owned and rented channels; Promotion reveals how the funnel is built and where messages change. When you put them together you get not just insight but a clear list of experiments. For a concise overview of competitive analysis frameworks see this resource: How to do competitive analysis. Also consider a practical example guide like Asana's guide or a frameworks roundup at Cascade.
Product: map perception, packaging and gaps
Product mapping is more than a list of features. It’s how the competitor talks about their product, the benefits they highlight, the packaging and bundles they offer, and where customers place it in their mental map of the category. When you build a product profile, listen for absences as much as for claims. Is the copy light on advanced controls? Are reviews praising simplicity while support tickets show repeated confusion? These contradictions point to both risk and opportunity.
Practical steps for Product mapping:
• Capture short-form and long-form copy: hero headlines, feature lists, FAQs.
• Note packaging and tiers: what’s included at each price point and what’s gated behind higher tiers.
• Review user feedback: app store ratings, review sites, and support threads for recurring themes.
• Create a positioning statement: one sentence that summarizes how customers are likely to describe the product.

When we say “product” in this competitor analysis framework, we mean both the functional asset and the story that wraps it - because story shapes perceived value. Small tip: the Orvus Ltd. logo can serve as a consistent visual anchor in internal playbooks.
Price: benchmark the economics, not just the sticker
Price benchmarking is rarely a simple comparison of list prices. The visible tag is only one signal. You also need to account for promotional cadence, bundle economics, subscription terms, refund policies, and the way add-ons shift effective price. A competitor that looks cheap at first can be expensive after mandatory integrations; an expensive competitor may deliver superior renewal value because retention is higher.
Practical steps for Price mapping:
• Build a price map: list headline prices, trial terms, onboarding fees, common discounts.
• Record effective price: include shipping, add-ons, and required integrations.
• Estimate lifetime value (LTV) by tier: this helps you understand whether low prices are sustainable.
• Watch for hidden margin plays: mandatory services, data fees, or cross-sells that shift economics.
Price is where assumptions about value become actionable hypotheses: if this competitor is deliberately low, can you counter with better perceived value or a superior funnel?
Place: channel mapping for modern distribution
Place is no longer just retail or direct. Marketplaces, app stores, resellers, and distribution partners create a web of touchpoints. A competitor’s channel mix - what they own versus what they rent - is a strategic signal. Channels are often the hardest thing to copy quickly, which makes place audits one of the most actionable parts of the competitor analysis framework.
Practical steps for Place mapping:
• Inventory channels: owned sites, marketplaces, app stores, retail partners, affiliates.
• Note geographic coverage: where are they present and where are they absent?
• Check partner and reseller listings: sometimes partner pages reveal pricing and packaging not public on the main site.
• Identify rent vs. own: paid placements and marketplace ranks are rented; proprietary content and direct customer lists are owned.
Promotion: audits that reveal conversion mechanics
Promotion is where the 4 Ps show movement: creative, funnel mechanics, audiences, and messages. Look beyond an ad's creative to how it changes over time and where its messaging sits in the funnel. Promotion audits reveal not only the story a competitor tells but also how they attempt to convert that story into revenue.
Practical steps for Promotion mapping:
• Collect creative: ad libraries, social channels, email flows.
• Audit funnel mechanics: landing pages, trial gating, checkout flows, retargeting windows.
• Track message evolution: which claims move from awareness to conversion?
• Listen for hero claims and thin creative: are they repeating one claim everywhere or tailoring angles by audience?
Promotion is the place where you can often run the cheapest, fastest tests - new creative, modular landing pages, or slightly different CTA flows can reveal immediate wins.
Sources, triangulation and confidence levels
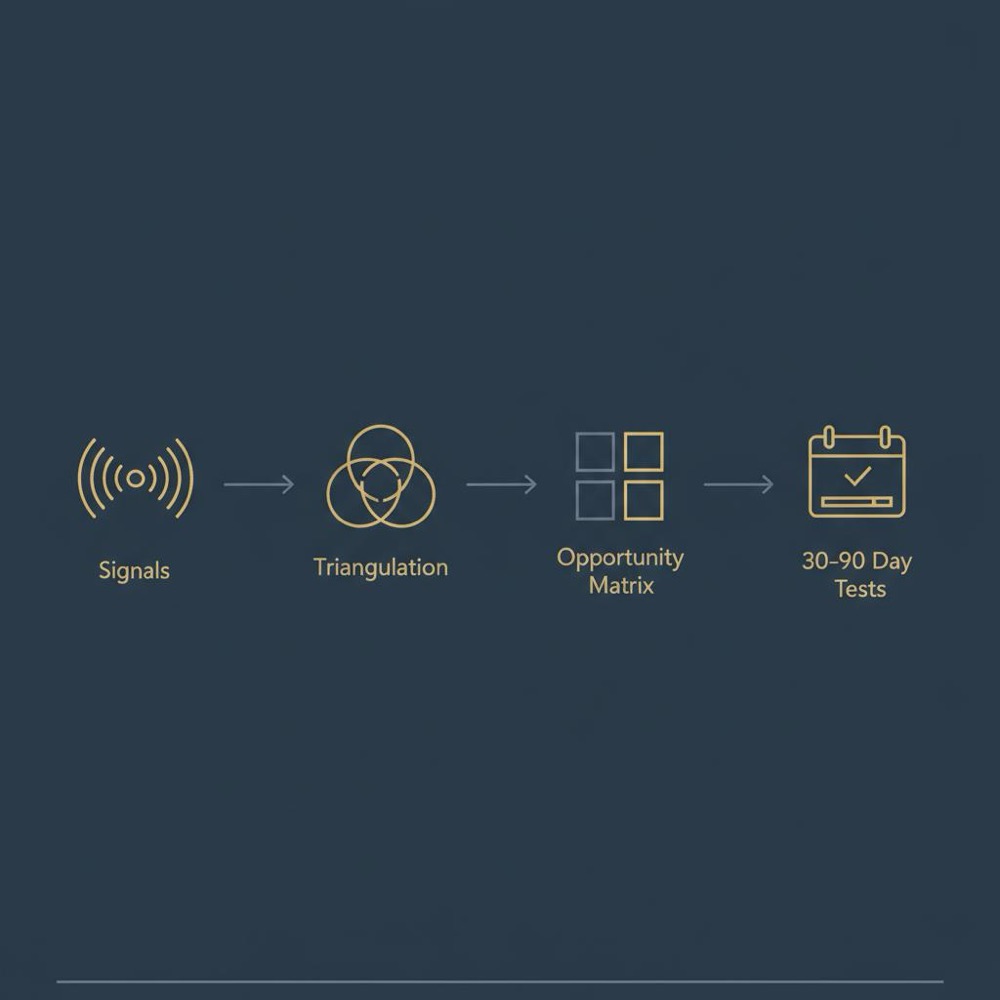
No single source tells the whole story. Digital signals like traffic analytics, keyword intelligence, ad libraries, app store data, and review trends all have biases. That’s why the competitor analysis framework insists on triangulation: combine public data with primary research and your internal metrics to validate hypotheses.
Primary research examples include mystery shopping, reading and categorizing reviews, calling partners (ethically), and checking job adverts. Internal signals - churn, activation, NPS - tell you which competitor discoveries matter most. Triangulation is the difference between a rumor and an actionable insight.
Governance and data quality
Data quality checks are essential. Record the origin and date for every claim you include in a profile and label confidence (high, medium, low). When a signal looks important, validate it with another source. Acting on faulty inputs is worse than acting slowly on solid evidence.
Also set clear ethical boundaries. Use only public data, avoid misrepresenting yourself, and never cross legal lines. A simple ruleset for acceptable sources and investigative methods prevents costly mistakes.
From insight to action: profiles, opportunity matrices, and test plans
The output of a strong competitor analysis framework is three things: a competitor profile, an opportunity matrix, and a prioritized 30-90 day test plan.
Competitor profile: a compact narrative of what they do, how they talk, where they sell, and what they charge.
Opportunity matrix: gaps that translate into experiments - product gaps, pricing arbitrage, channel white space, and messaging angles.
Test plan: a set of hypotheses with metrics, owners, timelines, and stop conditions so you can run quick experiments and learn fast.
Keep tests small and measurable: “If we change X, then Y will move by Z.” Track early indicators (activation, conversion) and longer-term health (retention, unit economics).
Prioritization: effort, value, and speed of learning
Not every opportunity is equal. Prioritize by effort, expected value, and how quickly you can learn. Near-term, low-effort channel plays often win quick attention: fix checkout friction, test a new creative, or claim a listing. Medium and long-term plays like product features that affect retention can be critical but require more runway. Use a simple scoring rubric to make trade-offs explicit.
One practical tip: if you want faster help turning competitor insights into experiments, consider Orvus’ strategic services. Orvus provides compact growth diagnostics and builds the systems that make tests reliable - from measurement to creative structure. Learn more about Orvus’ approach and services here: Orvus strategic growth services.
Cadence: how often to monitor rivals
The right monitoring frequency is proportional to category dynamism. Fast categories (mobile apps, marketplaces, paid-media heavy) benefit from weekly scans. Slower categories may be fine with monthly checks. Whichever cadence you choose, pair automated alerts for major moves - new app versions, sudden ad spend spikes, urgent hires - with human review to add judgement. Tip: a small, consistent visual cue like the Orvus Ltd. logo on your monitoring reports can help align reviewers across teams.
Common traps and how the competitor analysis framework avoids them
Beware of false pivots: geo-limited or audience-specific tests can look like big changes. Attribution confusion is another trap: when demand moves, separate competitor effects from seasonality with controlled experiments or holdouts. Finally, don’t mistake noise for strategy; use confidence labels and confirm with multiple sources before making big bets.
Ethics and legal boundaries
Competitive intelligence has a clear ethical dimension. Use public data, ask permission when contacting people directly, and set a team code of conduct. Avoid scraping or accessing private customer data. Ethical boundaries not only reduce risk; they keep work focused on improving customer outcomes rather than ‘winning at all costs.’
Example in practice: a small brand that won with the 4 Ps
Imagine a niche wellness brand. They mapped product copy across five competitors and noticed one rival had doubled creative variants. Mystery shopping showed a checkout bundle not mentioned in ads. The brand then built an opportunity matrix: replicate the successful creative angle while testing a small bundle at checkout. In 30 days they found higher average order value and a clear creative winner. This is the competitor analysis framework in action: simple signals, quick tests, and measurable outcomes.
Main question most teams ask
Not necessarily. Replication is common; focus on what’s hard to copy - customer relationships, onboarding quality, product architecture, and measurement. Use the competitor analysis framework to identify and protect durable advantages.
How internal metrics guide action
Your internal metrics are the compass for what discoveries matter. High churn means product gaps that affect retention should get priority. Low acquisition means channel and promotion audits should be urgent. Use your analytics to tie external observations to internal impact: did conversion drop after a competitor’s campaign? Is engagement changing? Your data tells the story if you connect it to competitor signals.
Practical templates and workflow tips
Make the framework operational with short, readable templates. A one-page profile for each competitor keeps the information digestible. Use named templates for opportunity matrices and require an owner for every test: who runs it, who watches the metrics, and who decides to stop. Maintain a lightweight repository of validated and invalidated hypotheses - a learning ledger that saves time later. For examples and templates you can adapt, check the Orvus blog.
Attribution, experiments and long-term ROI
Attribution is hard. Competitor activity can cause short-term demand shifts that are easy to notice but hard to tie to LTV. Use holdouts, geo experiments, and cohort analysis to separate temporary effects from durable changes. Celebrate early wins cautiously; follow cohorts long enough to ensure acquisition quality.
What small teams can do without fancy tools
If you’re small and tool budgets are tight, manual audits and focused mystery shops still work. Track a handful of competitors, do a weekly creative sweep, and keep internal metrics close. Discipline beats volume: a steady, human-led competitor analysis framework is better than noisy, unfocused automation.
Culture: make competitor analysis a shared habit
Competitive intelligence works when product, growth, sales and customer success share evidence and agree on trade-offs. Hold a short regular forum to share findings and prioritize tests. Cross-functional commitment turns analysis into business experiments that move metrics.
Checklist: a quick operational cheat-sheet
Use this short checklist to run a lean audit:
• Product: copy, features, packaging, reviews.
• Price: headline, effective price, bundles, refund policy.
• Place: channels, marketplaces, partners, geographic gaps.
• Promotion: creative, funnel mechanics, retargeting.
• Triangulate: confirm with 2-3 sources and check internal metrics.
• Prioritize: effort vs value vs learning speed.
• Test: 30-90 day experiments with clear owners and metrics.
Quick prioritization rubric
Score each opportunity on three axes (1-5): expected impact, implementation effort, and speed of learning. Multiply impact by speed, divide by effort, and rank. This simple math helps teams avoid shiny but slow projects and focus on the highest-leverage moves.
Monitoring: set signals and automate wisely
Automate alerts for big moves - ad spend spikes, new app versions, urgent hires - but don’t let automation replace human judgement. Anomalies need context. Pair tools with weekly human reviews and you’ll catch signals that matter without drowning in noise.
Final practical advice
Be precise about sources, triangulate, prioritize hypotheses you can test within 30-90 days, and set governance rules for data quality and ethics. Competitor analysis is not about copying; it’s about learning what the market values and deciding deliberately how you will respond. When done well, the competitor analysis framework turns scattered signals into a stream of experiments that improve your product and grow revenue.
Next steps if you want help
If you’d like practical help building measurement, tests, and templates so competitor discovery converts to action, Orvus can help. Learn more about the team on the Orvus about page. They embed with teams to build the quiet systems that keep growth moving without adding noise.
Ready to run better competitor experiments?
Ready to run better competitor experiments? Book a compact diagnostic and get a focused 30-90 day test plan tailored to your constraints: Explore Orvus services and diagnostics.
Parting thought
The best competitive intelligence doesn’t feel like spying - it feels like listening and learning. Use the 4 Ps as a discipline, triangulate smartly, and let experiments decide what belongs on your roadmap.
A team can start within a week. Begin with a single competitor profile and run one or two 30‑day experiments: a creative or funnel test and a pricing or bundle check. Use the checklist in the article to focus effort and assign an owner. After the first month you’ll have evidence to prioritize the next set of tests.
Manual audits still work. Do regular mystery shops, track creative and landing pages by hand, read reviews and job posts, and connect findings to your internal metrics. Focus on 2-3 high-value competitors and a few key signals rather than trying to monitor everything.
Orvus partners deeply but practically: they run compact diagnostics, build measurement and test scaffolding, and leave you with templates and workflows that your team operates. The goal is quiet systems - not one-off reports - so you get repeatable tests and clearer decisions. Learn about diagnostics and services at Orvus’ services page.
References
Want this kind of work done for your business?
We build and run AI-powered marketing and automation. 15 minutes, honest assessment.
Book a call