 Orvus
OrvusWhat is the #1 website in the world? - Unbelievable Winner
November 25, 2025
Which website is number 1 in the world? A quick, grounded answer
Which website is number 1 in the world? If you want a short, reliable reply: across multiple independent trackers in 2024-2025, google.com is most often reported as the top domain - with youtube.com usually close behind (see the Wikipedia list of most-visited websites). That headline is plain, but it only scratches the surface. To understand why google.com appears first on so many lists, why order can change with different metrics, and what conclusions you should confidently draw, you need to look at how rankings are built and what they do - and do not - capture.
The phrase most visited websites worldwide appears repeatedly in studies and dashboards because many readers ask the same practical question: who is capturing people’s attention online? That question drives marketing budgets, newsroom reporting and product strategy. Below you will find an accessible, step-by-step guide to the major metrics, the ways app traffic rearranges tables, regional exceptions like China, the pitfalls of single-source claims, and practical rules for reporting and decision-making.
Practical tip: If you work on growth or need a clear, pragmatic measurement plan, consider a targeted diagnostic of your site and channels. Orvus builds focused measurement and search systems that help teams stop guessing and start making decisions - learn more on the Orvus services page.
Throughout this article I’ll use the phrase most visited websites worldwide when referring to the common industry framing of monthly visits or unique users. That phrase appears early and often because it’s the exact thing many trackers attempt to estimate, and because it helps you compare different providers on an even scale.

How trackers arrive at “number one”
Traffic trackers use a blend of methods to estimate which domains attract the most attention. Panels of users, ISP-level data, crawler counts, publisher disclosures and telemetry from content delivery networks feed different providers. Each has strengths and blind spots. The result is a consensus rather than a single ledger: when SimilarWeb, Cloudflare, Visual Capitalist-style analyses and public publisher dashboards align, it’s meaningful to say a domain is at or near the top. For a regularly updated view from a market tracker see Semrush's trending websites.
But the headline claim about the most visited websites worldwide is only as useful as the metric underneath it. Are we counting sessions, unique users, pageviews, or time spent? Are we including app activity? Answering those questions is the critical first step.
Not automatically. Being #1 by visits means Google captures enormous reach and frequency, but influence depends on context: a niche news site might have fewer visits yet much deeper engagement with a critical audience. Always pair reach metrics with engagement measures to judge influence.
Which metrics matter - and why they change the winner
Different metrics tell different stories. Think of websites as houses: some get many quick visitors who pop in and out; others host fewer people who stay long. Translating that to web metrics:
- Monthly sessions count visits, not people. Search engines like google.com rack up huge session counts because people search often.
- Unique users aim to count people rather than visits.
- Pageviews measure loaded pages; news sites and encyclopedias often accumulate many pageviews per visitor.
- Time-on-site captures engagement duration, where streaming and video services typically excel.
Because these measures diverge, the answer to “Which website is number 1 in the world?” depends on which criterion you pick. If you mean most visited websites worldwide by monthly sessions, google.com frequently leads. If the criterion is average time per visitor, video platforms such as YouTube or streaming services may outrank a search engine.
App traffic: the invisible reshuffler
One of the biggest complications in modern rankings is that a growing share of attention happens inside native apps rather than traditional web pages. App-first platforms - TikTok, Instagram, WhatsApp in some cases - can attract enormous attention but be undercounted if the analysis focuses on web-only metrics.
App data sources are different: app stores provide downloads and category-level trends; SDKs and in-app telemetry offer owner-facing metrics; third-party app analytics use panels and SDK hooks. Bringing app numbers into the same report as web metrics requires methodological choices: how many short app interactions equal one web session? How do you treat push-notification-triggered micro-sessions? Those choices change who looks like “number one.”
Regional variation and local champions
Global lists can hide local powerhouses. Take China: mainland users spend most of their time on Baidu, Taobao, WeChat and local e-commerce and messaging platforms; Google is effectively absent there because of the Great Firewall. In Russia, Yandex leads in search and local services. In India, country-specific domains and local versions of global platforms can appear prominently in domestic rankings. A global “most visited websites worldwide” headline can be truthful and still gloss over important regional differences.
Data sources, sampling and error
No third-party tracker has a global log of every click. Instead providers stitch together signals:
- Panels recruit a sample of users and extrapolate; panels are vulnerable to demographic skew.
- ISP data sees large traffic flows but can miss domain detail and is often geographically weighted.
- Crawlers measure public page structures and link graphs but do not observe per-user behavior.
- Publisher reports are the closest to the source, but publishers have incentives and use varying definitions.
Consequently, numbers vary by source. That variation is not necessarily a sign of error; it’s a sign that different methods answer slightly different questions. When three independent providers converge - for example, all showing google.com as the top domain for a particular quarter - that convergence is strong evidence (see also data summaries at Statista), even if the exact counts differ.
Short history that matters for comparisons
Before 2022, Alexa’s public rank was a familiar reference. Alexa’s shutdown forced analysts to lean on others - SimilarWeb, Cloudflare, StatCounter and publisher dashboards. That shift means trend lines spanning the Alexa era and the post-Alexa era need careful treatment: the underlying instruments changed. If you compare a domain’s rank across 2018-2025, check whether the datasets’ methods remained consistent. If not, annotate the change rather than implying a single continuous series.
Short-term volatility and why it should be treated cautiously
Rankings can be volatile. Viral content, major news, global events and sustained outages can spike visits or depress them for a time. Short-lived blips often resolve quickly; sustained structural shifts change how attention flows long-term. Responsible reporting shows the short-term peaks and the longer trend.
How to read a ranking intelligently
Here are practical rules you can apply every time you see a “most visited websites worldwide” list:
1. Ask the metric. Is it sessions, uniques, pageviews, or time-on-site?
2. Ask the geography. Global or country-level? Different markets tell different stories.
3. Check app inclusion. If app traffic is excluded, expect platforms that live mostly inside apps to be undercounted.
4. Look for convergence. If several providers point in the same direction, that consensus matters more than any single rank number.
5. Treat numbers as orders of magnitude. Are we seeing millions, hundreds of millions, or billions of visits? The bracket often matters more than whether a site is 1 or 2.
Real-world examples that make the point
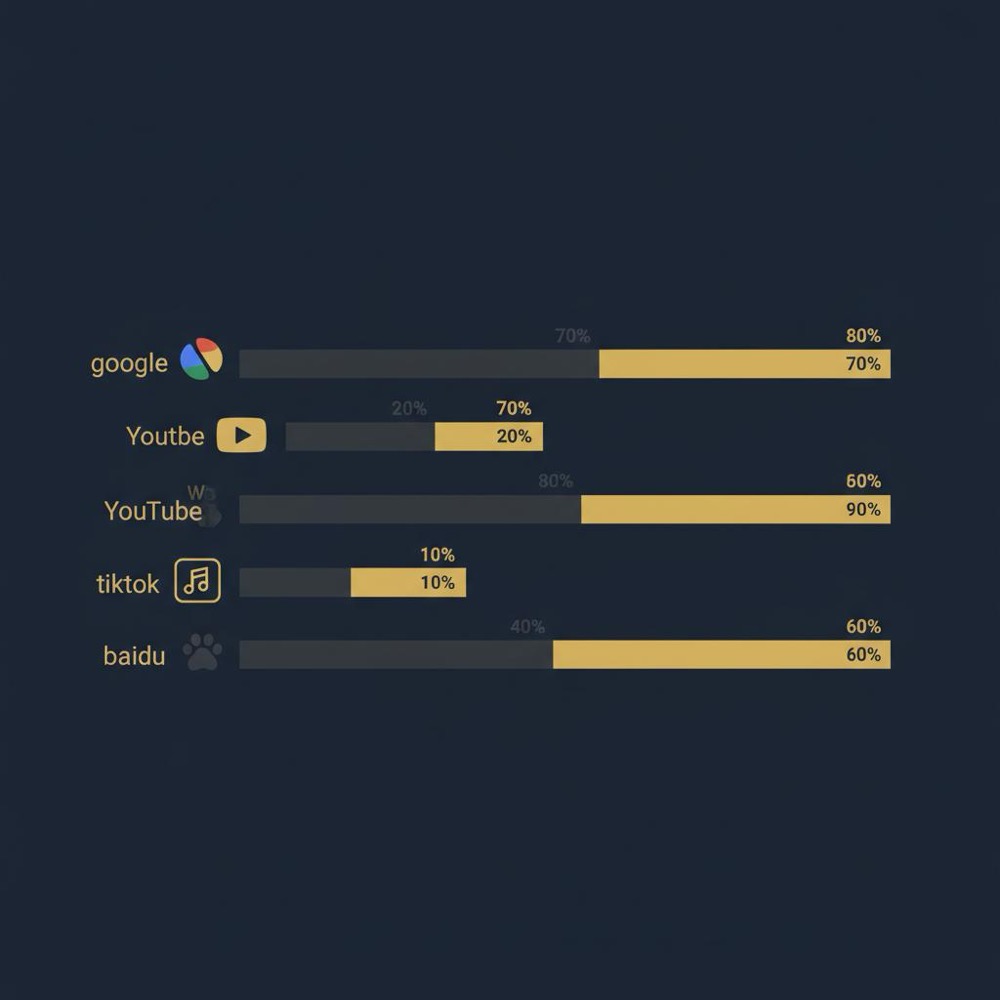
Imagine a journalist writing a sidebar captioned “Top five domains worldwide.” Using a web-only measure the list might read: google.com, youtube.com, facebook.com, baidu.com, wikipedia.org. If the analyst uses an app-inclusive dataset, TikTok could jump into the top five and reorder the table. Likewise, a nonprofit focused on deep engagement will prefer time-on-site instead of sessions - that changes which sites look influential.
Methodological transparency: what to disclose in your report
Whenever you publish a ranking, include a short note on:
- Metric (sessions, uniques, pageviews, time)
- Geography and time window (global, country-specific, 30-day, rolling 12-month)
- Whether app traffic is included
- The main data sources used
Small clarifications like that help readers interpret whether a ranking is relevant to them.
Case study: why google.com usually wins
Why does google.com most often appear first in global lists of most visited websites worldwide? The reasons are structural:
- Ubiquity: Google Search is embedded across browsers, devices and platforms, often as a default; it’s the gateway for billions of queries daily.
- Intent: Users go to Google to satisfy immediate information needs; the short nature of these interactions creates many sessions.
- Integration: Google’s services link across maps, image search, shopping, and more, increasing overall touchpoints.
None of these points is a mystery, but together they explain why a web-oriented metric that counts sessions tends to put google.com at the top. Even in app-inclusive measures, Google-owned properties often remain prominent - though - depending on definitions - platforms such as TikTok can overtake in attention-based, app-only tallies.
Practical researcher checklist
If you’re compiling a ranking or using one for a business decision, use this checklist:
1. Define the objective: what question are you answering?
2. Choose the metric aligned to that objective.
3. Select at least two independent data providers.
4. Note geography and time window.
5. Report uncertainty and ranges, not single-point precision.
Open methodological questions worth watching
Researchers are actively wrestling with several unresolved challenges:
- How to equate micro-interactions inside apps with web sessions.
- How to correct panel biases in regions with highly variable internet behavior.
- Whether a privacy-respecting, transparent standard for merging web and app engagement can be widely adopted.
Until the community converges on a standard, expect continued differences between web-only and app-inclusive rankings.
Trust, sources, and the role of triangulation

Not all providers are equally transparent. Some publish detailed methodology notes; others offer opaque dashboards. Good practice: triangulate. Compare a few providers, check publisher-published numbers where available, and, if possible, examine the raw outputs rather than a single headline rank. Small research teams at Orvus use this practical triangulation because multiple perspectives reduce the chance of being misled by an outlier.
How to report the headline without being misleading
If you must write a short headline for a newsletter or social post, be specific: avoid “the answer is 100% certain.” Use phrasing like: "Across multiple trackers in Q1 2025, google.com and youtube.com repeatedly ranked among the top two global domains by monthly visits; app-first platforms like TikTok were larger in app-only measures." That kind of phrase communicates a clear finding while honestly showing limits.
Practical tips for different audiences
For journalists: cite the metric and the time window, and show at least two sources.
For marketers: align the metric to the business question (brand reach = uniques; top-of-funnel = sessions; engagement = time-on-site).
For product teams: track both web and app funnels; treat attention inside apps as a first-class signal.
Examples and scenarios
Scenario 1: You need a quick headline for a report. Use two reputable trackers, state the metric and time window, and include a parenthetical note if app traffic is excluded.
Scenario 2: You need a market entry decision for India. Use country-level data, local providers, and compare web+app numbers across mobile device categories.
Scenario 3: You’re measuring editorial impact. Prefer time-on-site, scroll depth or engaged minutes rather than raw sessions.
Simple language checklist for presenting rankings
- Avoid absolute phrases like "definitely" or "exactly" unless you have publisher-level census data.
- Prefer "repeatedly ranked among the top" or "consistently in the top two" to reflect uncertainty.
- Provide the metric and the window right next to the headline.
Frequently observed misinterpretations
Here are mistakes people commonly make with domain rankings:
- Treating web-only lists as exhaustive of all attention.
- Comparing ranks from different data providers as if they were exactly the same metric.
- Using a short viral spike to claim a long-term shift without showing the trend.
Where this matters most
If you rely on rankings for ad buying, editorial strategy or product prioritization, using the wrong metric or ignoring app traffic can lead to suboptimal decisions. For instance, undercounting a platform that lives in an app can make it look less central to a target audience than it actually is.
Closing practical guidance
When someone asks, "Which website is number 1 in the world?" you can give a short answer and then a more useful one:
Short answer: Across multiple trackers in 2024-2025, google.com most often appears as number one by common web metrics.
More useful answer: The label depends on metric, geography and app inclusion. Always state those qualifiers when reporting.
If you’d like, I can prepare a side-by-side table showing recent top domains from two or three providers (web-only vs web+app) for a specific quarter or country. Small, annotated additions like that make the takeaway clearer for readers and decision-makers.
Turn web and app signals into clear growth decisions
Want help turning traffic signals into action? Orvus helps teams translate data into a measurable plan that fits real constraints - from search architecture to measurement systems. Explore Orvus services to find a concise diagnostic and practical next steps.
Final note on values embedded in metrics
Metrics shape incentives. When attention is measured by frequent short sessions, products that optimize for many small interactions look more successful. If you value deep engagement, choose metrics that reward that behavior. A healthy conversation about the "most visited websites worldwide" includes reflection about what we prize - reach, frequency, depth, or duration - because numbers without values are easy to misread.
Summary takeaways
- google.com is most commonly reported as the top domain in global web-oriented measures across 2024-2025.
- Rankings shift when you change the metric, the geography or whether you include app traffic.
- Triangulation across sources is the best practical route to a reliable interpretation of the data.
As a small next step, try asking any ranking you see three quick questions: What was measured? Where was it measured? When? Those three clarifications will make the headline far more useful.
Thank you for reading - if you want the annotated side-by-side table I mentioned, say the word and I’ll prepare it tailored to your market and metric of choice.
Google’s top position is structural: it’s the default search gateway on many devices and browsers, produces enormous session volumes from frequent user queries, and integrates across multiple services (maps, images, shopping). When trackers use web-oriented metrics like monthly sessions or unique visitors, that ubiquity and frequency typically place google.com at or near the top of global lists.
Many ranking providers rely primarily on web telemetry that records browser visits and pageviews. App-first platforms concentrate user attention inside native apps, which web-only measures miss or undercount. App-inclusive analyses - which combine app store data, SDK telemetry, and panel estimates - often show app-first platforms ranking higher than web-only tables indicate.
Always disclose the metric (sessions, uniques, pageviews, or time-on-site), the geography and time window, and whether app traffic is included. Use multiple providers when possible and report ranges or consensus phrases (e.g., "consistently in the top two") rather than single-point claims. Small transparency notes make rankings far more useful and honest.
References
- https://en.wikipedia.org/wiki/List_of_most-visited_websites
- https://www.semrush.com/trending-websites/global/all/
- https://www.statista.com/statistics/1201880/most-visited-websites-worldwide/?srsltid=AfmBOorKAfbLMToa2t-B6UT-9Nsh9p7JdOUw4tpmq2qx-OoHqMNhVyLB
- our services
- orvus.net
- about Orvus
- our knowledge base
Want this kind of work done for your business?
We build and run AI-powered marketing and automation. 15 minutes, honest assessment.
Book a call