 Orvus
OrvusHow much is 1000 impressions worth on Twitter? An operator guide
February 14, 2026
What 1,000 impressions means for twitter seo and campaign value
The phrase twitter seo is often used to describe efforts that surface content or links in social search and feeds, and it matters because impressions feed the top of many funnels. In practice, 1,000 impressions is a unit of attention that you can measure and, with a few downstream rates, convert into expected clicks, conversions, and revenue.
Convert impressions to expected revenue using campaign CTR and CVR and a per-conversion value, compare that figure to platform CPM, then decide to buy, optimize, or test based on the comparison and measurement quality.
Start by defining the metrics. In ad measurement CPM, or cost per mille, is the cost to buy 1,000 impressions and the definition and related metrics are covered in IAB measurement guidance IAB guidance on ad metrics.
Impressions are a platform-level count of how many times content or an ad was shown. CTR, the click-through rate, converts impressions into clicks. CVR, the conversion rate, converts clicks into the actions you value. For paid impressions CPM is the direct monetary cost for 1,000 views. For organic impressions there is no direct media cost, but you can still translate impressions into expected economic value by applying CTR, CVR, and the per-conversion value.
The decomposition impressions then CTR then CVR then per-conversion value is central to any operator looking to compare buying impressions to optimizing the funnel. This approach makes trade-offs explicit: raise CTR or CVR and the same 1,000 impressions can be worth more to your funnel.
Quick definitions: impressions, CPM, CTR, CVR
Paid versus organic impressions and why it matters
Paid impressions have an explicit cost that you see as CPM in the ad dashboard. Organic impressions have no line-item cost but do use attention that can be modeled with the same CTR and CVR math. The practical difference is that paid buys let you scale impressions reliably and measure CPM directly, while organic reach depends on content, network effects, and platform algorithms.
How paid CPM sets the direct cost of 1,000 Twitter impressions

Industry benchmark reports from 2024 and 2025 show many advertisers see low single-digit CPMs on Twitter, with commonly reported ranges roughly between two and six dollars, but those figures vary by objective, audience, and timing Hootsuite benchmarks summary and WebFX benchmarks.
What moves CPM in the short term? Three practical drivers to check are campaign objective, audience targeting, and seasonality. Objective changes the auction dynamics and bid strategy. Audience settings alter competition and audience size. Seasonality drives demand and can push CPMs higher when many advertisers target the same users.
Operational checks when CPM is higher or lower than expected include verifying your objective aligns with the metric you care about, reviewing audience overlap and exclusivity, and checking bid strategy or pacing. These items point to whether you should change creative, tighten targeting, or run a small test to understand the cost drivers.
Estimating the funnel value of 1,000 impressions for twitter seo
The most repeatable way to estimate value per 1,000 impressions is a simple formula: value equals impressions times CTR times CVR times per-conversion value. That decomposition turns an abstract impression count into an expected monetary outcome, assuming you use campaign-level CTR and CVR inputs where possible HubSpot on how to calculate ad value.

Walk through the terms. Impressions are the base. CTR is the probability a displayed item generates a click. CVR is the probability a click becomes the conversion you track. Per-conversion value is the average order value, lifetime value, or price you assign to a lead. Multiplying those four terms yields expected revenue per the impression block you choose to evaluate.
Run a quick revenue-per-1,000 diagnostic with a simple template
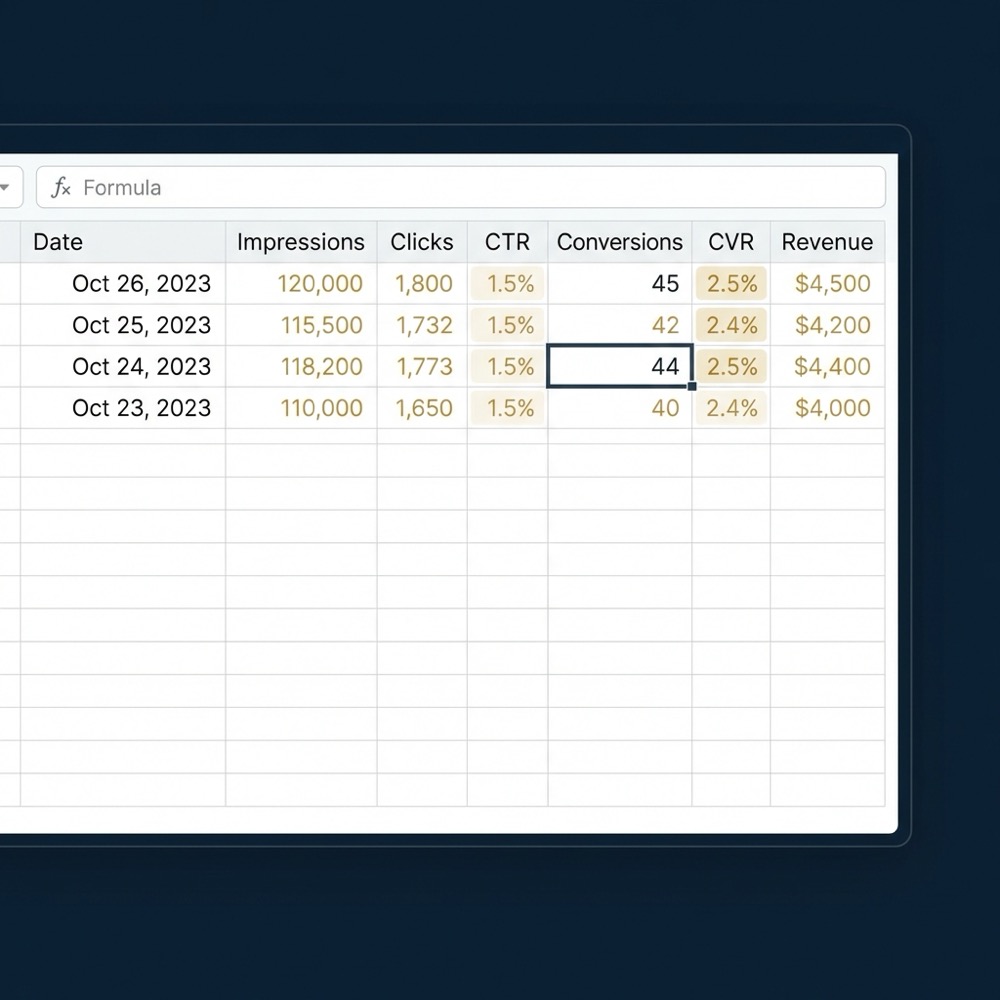
Use a small spreadsheet with the four terms as inputs and keep fields for platform CPM, campaign CTR, conversion rate, and average order value. Update the inputs after a short test so your estimate uses campaign-level data rather than market averages.
When you run the math the levers are clear. A fractional increase in CTR or CVR can often move expected value more than a similar percentage change in CPM. That is why many operators put measurement on CTR and CVR improvements first, then consider buying incremental impressions once funnel performance is stable.
Remember that platform reporting gives CPM and clicks and many analytics setups provide conversions when properly instrumented. To trust the calculation you must ensure clicks from campaigns are tagged and tracked so CTR and CVR match the same user interactions and conversions.
From impressions to revenue: CTR and CVR math
Use a stepwise thought process. For 1,000 impressions, expected clicks equal 1,000 times CTR. Expected conversions equal expected clicks times CVR. Expected revenue equals expected conversions times the per-conversion value. This algebra is straightforward, but its accuracy depends entirely on clean inputs coming from the same campaign window and tracking setup HubSpot on campaign metrics.
Example decompositions without brand-specific numbers
It is useful to run placeholder scenarios while you gather real inputs. Use conservative CTR and CVR placeholders until you have campaign data. The placeholders show direction and expose which rate improvements change the expected value per 1,000 impressions the most. Do not treat placeholders as forecasts for resource allocation.
Quick method: calculate value per 1,000 impressions (step-by-step)
Step 1, choose your CTR input. Prefer campaign-level CTR from the same reporting window and creative set. If you lack campaign CTR, use a short paid test to get a reliable number before making decisions based on impressions.
Step 2, choose your CVR and per-conversion value. Use site analytics or CRM data tied to UTM parameters to ensure clicks from the campaign map to conversions and value. If you value leads rather than orders, use a per-lead value consistent with your sales conversion assumptions.
Step 3, compute revenue per 1,000 impressions using the formula impressions times CTR times CVR times per-conversion value. Compare that figure to CPM, the cost to buy 1,000 impressions, to understand whether buying makes sense or whether funnel work should come first.
Operational guidance for spreadsheets: keep columns for campaign, impressions, clicks, conversions, CTR, CVR, per-conversion value, revenue per 1,000, and CPM. Use consistent naming and UTM tags so the joins between platform reporting and analytics are dependable.
When you compare revenue-per-1,000 to CPM, treat the result as directional. If revenue-per-1,000 is consistently below CPM, investigate CTR and CVR improvements before increasing paid spend. If revenue-per-1,000 exceeds CPM, scale carefully and keep testing for diminishing returns.
When to buy impressions versus optimize organic twitter seo
The direct test is a comparison: calculate expected revenue per 1,000 impressions and compare it to platform CPM. If expected revenue materially exceeds CPM after accounting for measurement noise and attribution windows, buying impressions can be justified. Otherwise prioritize funnel improvements that raise CTR or CVR HubSpot guidance on ad valuation.
Signals that favor optimization over paid spend include low campaign CTR, low landing page CVR, inconsistent UTM tagging, and poor attribution. These signals suggest the funnel is not converting reliably enough to make buying impressions cost effective. Address the bottleneck and then reassess with a fresh experiment.

Another practical signal is audience scale and reuse. If your organic or paid audiences are small and you see strong engagement, a small paid push can prove ROI quickly. If audiences are large but conversion is weak, send resources to conversion rate work rather than simply buying more impressions.
Finally, maintain a short decision log. For each buy versus optimize choice record the inputs, the date, the test size, and when you will re-evaluate. This makes future comparisons easier and prevents repeated errors from stale assumptions.
Benchmarks: what recent reports say about Twitter CPMs, CTRs, and CVRs
Published benchmarks from 2024 and 2025 show widely reported Twitter CPM ranges that often fall in the low single-digit dollars, with many reports centering roughly between two and six dollars. Treat these ranges as directional starting points rather than definitive values for your campaigns Hootsuite benchmarks summary.
CTR and CVR benchmarks vary strongly by objective and vertical and are often reported as fractions of a percent to low single digits. That means 1,000 impressions commonly produce a small number of clicks, and small absolute changes in CTR or CVR can significantly change the expected value per 1,000 impressions Sprout Social benchmarks and context and Socialinsider benchmarks.
Why treat benchmarks cautiously? Benchmarks aggregate many strategies, audiences, and objectives. Your specific creative, targeting, market, and landing experience will determine whether your CPM, CTR, and CVR fall above or below published ranges. Run small tests to validate any benchmark you intend to use for decisions.
Use benchmarks to set guardrails for early experiments. They help you pick reasonable test CT A and CVR targets and to flag when a campaign is performing well or poorly compared to the broader market. But always prioritize campaign-level measurement as the source of truth.
Practical measurement checklist and tools for accurate value-per-1,000 calculation
To compute reliable revenue per 1,000 impressions pull these metrics from the platform and analytics: impressions, spend, CPM, clicks, CTR, conversions, CVR, and per-conversion value. When available, include viewability and placement data to refine the effective impression count Twitter Ads reporting guidance and Improvado's guide.
In analytics capture UTM-tagged landing page traffic, conversion events, and revenue or lead value tied to those events. If possible use server-side attribution or a consistent conversion window so platform clicks map to the same conversion outcomes you count in finance or CRM systems HubSpot on tracking and attribution.
refresh revenue per 1,000 calculation automatically
update inputs after each test
Prefer light automations: a simple spreadsheet or a small dashboard that joins exported platform reports with analytics exports is often enough. Keep naming consistent across campaigns so joins do not require manual cleanup. Automate a weekly refresh if you run repeated experiments.
When building dashboards include a column that computes revenue per 1,000 impressions and a comparison to platform CPM. That single visual helps decision makers see when buying impressions is likely to be cost effective and when the team should pause paid scaling to work on funnel improvements.
Common mistakes when valuing impressions on Twitter
A frequent error is relying on platform CPM alone to decide whether to buy. CPM is the cost side of the equation, but it does not tell you whether impressions create conversions unless you fold in CTR, CVR, and per-conversion value HubSpot on ad value.
Another common mistake is applying stale or generic benchmarks without validating them with small tests and campaign-level measurement. Benchmarks can mislead if your creative, audience, or offer differs materially from the aggregate sample used to produce the benchmark Sprout Social benchmarks.
Attribution pitfalls are also common. Missing UTM tags, misconfigured conversion pixels, or inconsistent naming lead to mismatches between platform clicks and analytics conversions. Fix naming and tagging first, then compute CTR and CVR from joined data so your revenue-per-1,000 figure is trustworthy.
Optimization levers that increase value per 1,000 impressions
Raise CTR by testing creative and audience combinations. Small creative variations often change engagement more than broad targeting tweaks. Use iterative creative testing and prioritize the variants that deliver higher CTR without dramatically increasing CPM Hootsuite benchmarks and creative notes.
Raise CVR by improving landing pages, tightening the message match between creative and landing content, and simplifying forms or steps in the conversion path. Measurement hygiene and consistent naming help you see whether a CVR improvement is real or an artifact of misattribution.
Operationally, track tests with a naming convention and a short experiment log. That discipline makes it possible to spot which changes truly move CTR and CVR and which are noise. Over time this approach builds a repeatable creative and audience testing system that compounds value.
Sample scenarios: estimating value for ecommerce and lead-gen
The same formula applies to ecommerce and lead generation. For ecommerce replace per-conversion value with average order value. For lead-gen replace it with a per-lead value, which can be based on historical close rates and lifetime value estimates. The algebra remains impressions times CTR times CVR times value per conversion HubSpot on conversion valuation.
Label placeholders clearly when you share scenarios. For an ecommerce scenario the sensitivity to AOV is high. For lead-gen the sensitivity is to per-lead value and downstream close rates. In both cases the same inputs matter most: campaign CTR, landing CVR, and the value you assign to a conversion.
When you report scenarios to stakeholders include the assumptions, the attribution window, and how you computed per-lead or per-order value. Transparency on inputs prevents overconfidence and makes it easier to update the scenario when new test data arrives.
How to test assumptions with small buys and A/B tests
Design tests that measure CPM, CTR, and CVR simultaneously. Run a small paid experiment, keep the creative set limited, and ensure UTM tags are in place so analytics capture conversions tied to those clicks. That gives you a direct read on revenue per 1,000 impressions for that creative and audience combination Twitter Ads testing guidance.
Control variables and document test conditions. If you change both creative and audience at once you will not know which lever drove any difference. Keep a naming convention that records the test date, objective, and variant so results are auditable and repeatable.
Decide when to scale based on the comparison between revenue per 1,000 impressions and CPM, and on variability in conversion outcomes. If results are noisy extend the test sample or run a quick replication before scaling spend. Use the experiment log to track replications and any contextual differences.
When impressions are not the right metric
If your goal is deep engagement, longer watch time, or brand lift impressions are an imperfect proxy. Engagement metrics or conversion outcomes often align better with those objectives, and choosing the wrong objective changes CPM and downstream expectations Sprout Social on objectives and metrics.
When conversions matter pick an objective and measurement approach that links ad interactions to the conversion event you value. That alignment ensures the CPM you pay is compared to an appropriate revenue-per-1,000 or cost-per-acquisition benchmark.
Bringing it together: a simple decision flow for 1,000 impressions
Compute revenue per 1,000 impressions, compare to platform CPM, and then choose one of three actions: buy, optimize, or test. If revenue-per-1,000 comfortably exceeds CPM and tracking is clean, scale carefully. If revenue-per-1,000 is below CPM, prioritize CTR or CVR improvements. If inputs are uncertain, run a small controlled test to reduce uncertainty HubSpot on decision frameworks.
Re-run calculations after every significant test and update benchmarks from your experiments, not from aggregated market reports alone. Over time this discipline builds a dataset that reflects your creative, audience, and funnel constraints so decisions become more confident and less speculative.
Conclusion and next steps for operators
The practical path starts with clean measurement: tag campaign links, ensure conversions are tracked, and compute revenue per 1,000 impressions using campaign CTR and CVR. Compare that figure to CPM to decide whether to buy more impressions or to fix the funnel first.
Immediate steps for teams: capture UTM tags on current campaigns, compute a first revenue-per-1,000 using recent campaign data, run a small test if inputs are uncertain, and build a simple dashboard that refreshes those inputs weekly. These actions create an operational routine that turns impressions from a vanity metric into a measurable funnel input.
For teams building longer-term systems, Orvus Limited can help design measurement and small automations that keep the calculation current and auditable. In many cases a compact diagnostic and a naming and tagging cleanup are effective first steps before larger investments in tooling.
Multiply impressions by CTR, then by CVR, then by the per-conversion value. Use campaign-level CTR and CVR where possible and ensure clicks are UTM tagged so analytics map conversions to the same campaign.
No. CPM shows the cost to buy impressions but you must compare it to revenue per 1,000 impressions, which requires CTR, CVR, and per-conversion value to determine economic sense.
Run small-budget tests with controlled creative and audience settings, use consistent UTM tagging and naming, and compare campaign-level results to public benchmarks to confirm applicability.
References
Want this kind of work done for your business?
We build and run AI-powered marketing and automation. 15 minutes, honest assessment.
Book a call