 Orvus
OrvusIs 75 a good SEO score? A systems view
February 9, 2026
This article explains what a 75 typically means in different tools, why scores differ, which performance metrics move scores most reliably, and a practical three step audit plus prioritization approach operators can use to act with clarity.
What does a numeric "75" mean for an SEO score?
When an automated audit returns a number like 75, interpret it as a mid-range result that usually means some improvement is needed rather than an outright failure. The specific meaning depends on the tool and the metrics it uses, so read the number as a diagnostic signal, not a final grade for overall site health. For Lighthouse style performance scores, a mid-range numeric value typically indicates there are performance issues that affect user experience and measurement, so treat the score as a prompt to investigate rather than a final answer Lighthouse scoring. See the Chrome docs on Lighthouse performance scoring Chrome Lighthouse performance scoring.
Different products bundle different checks into a single score. Commercial site-audit tools often mix crawlability, on page issues, and best practices into one index, and many vendors treat scores above about 90 as excellent and 50 to 90 as mixed. That places a 75 inside a mixed band where action is usually advisable but not urgent in every case. Keep in mind that the same numeric value in two tools does not imply identical problems.
run parallel scans and compare outputs
compare metrics and weightings
Use this section to set expectations. A 75 often sits above the midpoint for vendor banding, but still signals actionable items. Treat the number as a starting point for a targeted diagnostic workflow rather than a single KPI to chase.
Why audit tools produce different scores
Audit tools measure different things and apply different weightings, which is why two tools can give the same site different scores. Lighthouse emphasizes performance, accessibility, and best practices, and it weights performance substantially using Web Vitals metrics. When you compare two scores, ask which metrics the product measures and how it weights them Lighthouse scoring.
Commercial site-audit products add layers that Lighthouse does not, such as large scale crawlability checks, in depth on page issue detection, and severity models for metadata and linking problems. Those additions can move a composite score independently of raw front end performance. Before interpreting a numeric index, check the vendor documentation so you know whether the score reflects technical performance, crawl issues, content duplication, or a blend of these.

Core Web Vitals and why they move scores
Core Web Vitals are the primary drivers of performance related audit scores because they map directly to perceived load and responsiveness. Largest Contentful Paint, Cumulative Layout Shift, and First Input Delay or INP capture how quickly a page appears to load, how stable the layout is during load, and how responsive it is to user input. Many tools feed these measures into their performance weighting, so improvements here usually lift performance sub scores and therefore composite scores Core Web Vitals.
Turn a numeric score into a focused audit
Run the focused three step audit: automated scans, crawl and index checks, then triage fixes by impact and cost.
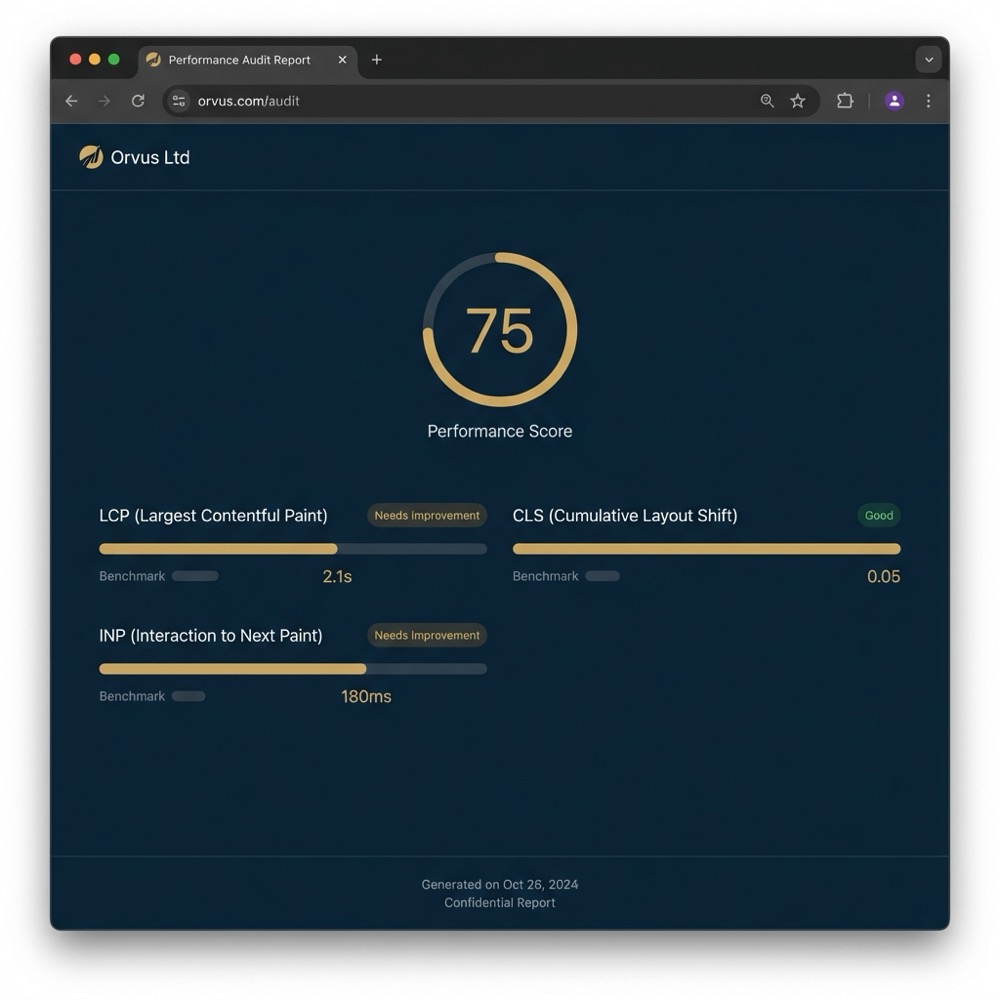
Each metric matters for different reasons. LCP ties to perceived page load time and often moves when server response, render blocking resources, or large images are addressed. CLS points to layout stability issues, often from late loaded images or injected content. INP or FID signals interactivity, and reducing main thread work helps here. Addressing these elements tends to improve performance scores across modern audit tools.
A practical 3-step audit to interpret and act on a 75
Step 1, automated scans: run Lighthouse for performance focused diagnostics and a commercial site-audit product to surface crawl and on page issues. Parallel scans give you complementary views, with Lighthouse flagging front end performance and a site-audit product highlighting crawlability and metadata problems Lighthouse scoring.
Step 2, crawl and index verification: confirm Search Console signals and run a full site crawl to find server errors, redirect chains, or orphaned pages that automated scans might surface only as symptoms. A crawler helps validate whether flagged issues affect indexation and whether they are systemic or isolated.

Step 3, triage by impact and cost: map each issue to likely traffic or conversion impact and to engineering cost. Prioritize high impact, low cost changes first. Use short experiments when possible to test changes and measure outcomes before wide rollout. This framework helps prevent chasing marginal score moves at the expense of user value or revenue.
How to check crawl, server, and indexing signals
Start in Search Console. Look at the coverage report for pages marked as excluded or errored, use URL inspection for specific problem pages, and verify the sitemap status to ensure important paths are discoverable. These checks confirm whether score deductions relate to indexation rather than cosmetic or isolated issues.
Next, run a full crawl with a crawler to reveal redirect chains, server response codes, and orphaned pages. Crawlers can identify patterns such as long redirect chains or intermittent 5xx responses that audit UI summaries may not show clearly. Those server and redirect issues often have outsized impact on how tools aggregate site health metrics Screaming Frog SEO Spider.
When you see crawlability or server problems, treat them as higher priority than cosmetic best practice flags. Fixing a server error or resolving a crawl block typically restores discovery and indexing, which can influence visibility and downstream traffic more than minor markup tweaks.
Decision criteria: when is a 75 acceptable and when is it a red flag?
Context matters. A 75 can be acceptable for low priority or low traffic pages, but it becomes a red flag for high traffic landing pages or conversion points. Consider current traffic trends, ranking positions for priority queries, and whether the page sits inside a constrained conversion funnel. Those factors determine urgency. For a practical perspective on score versus business impact see this analysis Understanding Google Lighthouse Scores.
No. A 75 is a mid range, tool dependent signal that usually warrants targeted checks and prioritized fixes, especially for pages that drive traffic or conversions.
Use this checklist to decide: is the page driving meaningful organic traffic, does it appear in search results for priority queries, and are conversions or leads sensitive to page performance? If the answers are yes, treat the 75 as actionable and schedule fixes promptly. If not, document the issue and deprioritize based on impact and cost.
Also consider data quality. If your analytics or Search Console data are incomplete, a numeric score alone is a poor decision basis. Invest time to validate measurement before large engineering work. Often the right first step is to ensure you can measure outcomes reliably so you can link technical work to business signals.
High-leverage fixes that most reliably move composite scores
Performance oriented fixes that address Core Web Vitals tend to deliver the largest, most predictable improvements in performance sub scores. Work on image optimization, serve properly sized images, and ensure images use efficient formats. Reduce render blocking by moving critical CSS inline and deferring non essential scripts. These changes often move LCP and INP metrics, which many tools weight heavily Core Web Vitals.

Server and crawl issues are high leverage. Fix intermittent 5xx responses, clean up redirect chains, and resolve robots or header problems that block indexing. A crawler based audit exposes these issues so you can prioritize fixes that restore discoverability and indexing health Technical SEO guidance.
On the content side, deduplicate and consolidate thin pages, fix metadata that confuses crawlers and users, and add structured data where it clarifies intent for search engines. These actions improve on page signals that commercial site-audit tools include in composite scoring, and they improve the likelihood of relevant SERP features for high value pages.
Prioritization framework: impact versus cost
Use a simple two axis model: likely traffic or UX impact on one axis, engineering cost and risk on the other. Rate each candidate fix and place it into quadrants: high impact low cost, high impact high cost, low impact low cost, and low impact high cost. Execute the top left quadrant first to maximize return on engineering time.
Example scenarios help. A single image that causes slow LCP on a main landing page can be a high impact low cost win. Rewriting large parts of a template to change rendering strategy may be high impact but also high cost. Document each decision and include an expected measurement window so you can validate before and after effects.
Where uncertainty is high, favor experiments. Use A B tests or staged rollouts for risky changes. Record rollback plans and measurement criteria. This reduces the chance of regressions and keeps the team accountable to user and business metrics rather than a raw numeric score Lighthouse scoring.
Common audit and remediation mistakes to avoid
A common mistake is chasing the score rather than the outcome. Teams can expend effort fixing low leverage items that barely affect traffic or conversions while ignoring server problems that block indexation. Prioritize changes that link to visible business metrics.
Overfixing and shipping changes without testing can cause regressions. Performance work sometimes introduces rendering regressions or accessibility issues when not validated. Always test in a staging environment, implement monitoring, and have a rollback path. That practice preserves both user experience and measurement integrity What is a Good Site Audit Score.
Practical scenarios: ecommerce and service sites
Scenario A, ecommerce product category page scoring 75. For category pages check Core Web Vitals first and whether product listing changes cause frequent layout shifts. If the page is a primary entry for shoppers, prioritize image sizing, server responses for catalog queries, and canonicalization to avoid indexation of near duplicate faceted pages. These actions protect ranking potential and conversion funnels.
Scenario B, local service landing page scoring 75. For service landing pages focus on conversion sensitive items first. Fix metadata and add or correct structured data to improve SERP presence. If site audits show server or crawl problems, resolve those quickly so the page can be discovered and shown in search results for local intent queries SEO Audit guidance.
Tie each scenario back to traffic and conversion metrics. If the page generates search traffic and conversions, even a mid range score warrants prioritized fixes. If the page is low traffic and non strategic, document the issue and include it in a lower priority backlog.
How to measure outcomes so the score supports revenue decisions
Track organic traffic, ranking visibility for priority queries, and conversion metrics alongside technical metrics such as Core Web Vitals and server error rates. Use a short measurement window after a change, for example a few weeks, but adapt the window to traffic volumes so you have meaningful samples.
Controlled experiments make outcomes clearer. When possible A B test major performance or content changes on representative pages. Where experiments are not possible, compare cohorts or use time series analysis with annotation for deployments so you can separate noise from signal. Remember that the translation from score movements to revenue is site specific and depends on funnel constraints and data quality What is a Good Site Audit Score.
Recommended next steps and a minimum plan after seeing a 75
Immediate checks: run Lighthouse and a commercial site-audit scan in parallel, check Search Console coverage and specific URL inspection, and run a full crawl to find server and redirect issues. These steps confirm whether the 75 flags performance problems, indexation gaps, or content issues Lighthouse scoring. Also consult PageSpeed Insights documentation PageSpeed Insights docs.
Near term: fix high impact, low cost items such as image sizing, critical CSS adjustments, and intermittent server errors. Document changes, set measurement windows, and track organic traffic and conversions during and after deployment. Build a 30 to 90 day prioritized backlog that balances impact and cost and includes rollback plans and measurement criteria.
Conclusion: read the score in context and use it as a diagnostic signal
A numeric score of 75 is typically a tool specific, mid range signal that indicates some improvement is likely beneficial. It is not a definitive statement about your organic performance or revenue potential, so interpret it alongside traffic, ranking, and conversion data.
Use the three step audit and the prioritization framework outlined here to turn the score into focused work. Consider bringing in a systems oriented partner when measurement gaps, funnel constraints, or engineering limits make prioritization unclear. The goal is to convert a numeric prompt into targeted fixes that support search driven outcomes.
Not necessarily. A 75 is a mid range signal that flags areas for improvement. Whether traffic is affected depends on existing rankings, the page's role in your funnel, and any crawl or server problems.
Start with Core Web Vitals issues that affect perceived performance and any server or crawl errors that block indexing. These typically deliver the most reliable lift in composite scores.
You can deprioritize low traffic pages after documenting issues and ensuring measurement is reliable. Focus resources on pages that drive meaningful search traffic or conversions.
When measurement gaps or technical constraints make decisions unclear, consider a systems oriented partner to help align fixes with your funnel and revenue signals.
References
- https://developers.google.com/web/tools/lighthouse/scoring
- https://developer.chrome.com/docs/lighthouse/performance/performance-scoring
- orvus.net
- https://www.screamingfrog.co.uk/seo-spider/
- https://web.dev/vitals/
- https://wplifeline.com/understanding-google-lighthouse-scores-what-you-actually-need-to-know/
- our services
- https://www.semrush.com/blog/site-audit-score/
- https://ahrefs.com/blog/seo-audit/
- https://developers.google.com/speed/docs/insights/v5/about
- our knowledge base
- about Orvus
Want this kind of work done for your business?
We build and run AI-powered marketing and automation. 15 minutes, honest assessment.
Book a call