 Orvus
OrvusWhat are the 5 C's of strategic analysis?
December 11, 2025
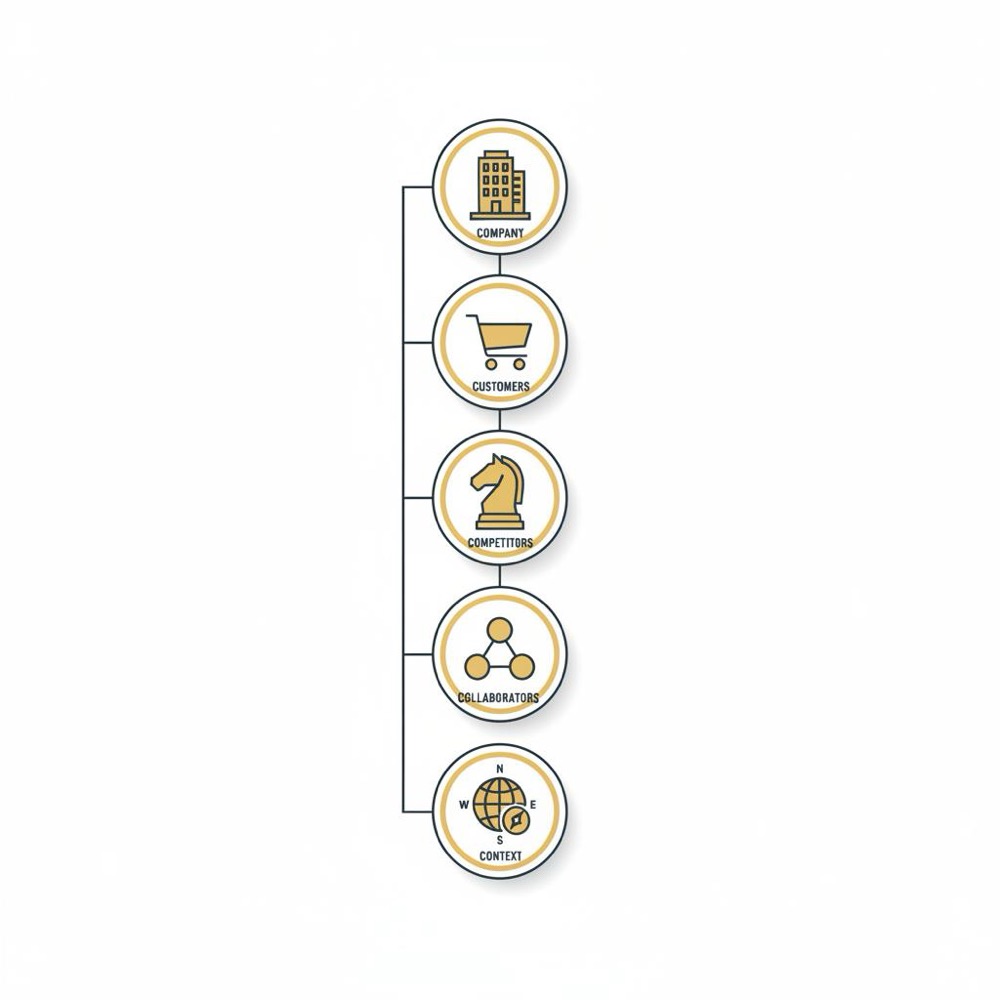
What are the 5 C's of strategic analysis? Right away: the 5 C's of strategic analysis is a compact, action-first framework that helps teams move from messy signals to confident choices. Use it as a map and a habit: start with what you control and expand outward. In practice this means Company, Customers, Competitors, Collaborators and Context-in that order-so you ground decisions in capacity before projecting into the market.
The practical power of the 5 C's of strategic analysis
The strength of the 5 C's of strategic analysis is its simplicity. It gives leaders a repeatable sequence for diagnosing opportunities and risks without losing time to endless slides. Start with a Company audit that surfaces real constraints. Then move to Customers, measure where value happens, compare with Competitors, check Collaborators for dependencies, and finally test Context scenarios. Each C feeds the next, and each observation should point to a testable hypothesis.

How this guide is structured
This article walks the sequence step-by-step, shows how to mix quantitative and qualitative evidence, highlights common traps, and gives practical experiments you can run in 30 to 90 days. Expect checklists, mini case studies and measurement notes that are designed for digital-first businesses.
1. Company: start inside the house
Begin with a clear, factual Company review. A strong Company audit answers three simple questions: what can we do well today, what can we not do, and what evidence supports those answers? Focus on operational strengths, financial health and process signals as much as headline metrics.
Core metrics to pull immediately: revenue and margin trends, CAC, LTV by cohort, churn rates, funnel conversion metrics, ARPU and gross margin by product or channel. But don’t stop there. Process metrics-deployment frequency, lead time, supplier reliability and time-to-fulfill-often determine whether a strategy is scalable.
A realistic Company audit also surfaces the tacit rules: how risk-averse leadership is, how quickly teams can execute a 30-day experiment, and whether budgets favor short-term media or longer-term platform work. These cultural constraints define what’s feasible.
Example: a small SaaS business had strong product engagement but stalled growth. A Company-focused review found onboarding capacity could not handle a spike in trial signups. Because the conversion required human touch, scaling media would only increase frustration. The strategic move was to redesign onboarding and automate key touchpoints before increasing acquisition spend.
2. Customers: segment by behavior and jobs-to-be-done
Who are you actually selling to? The answer needs to be behaviorally precise. Use cohort analysis, funnel drop-off points and value distribution combined with interviews and diary studies. Ask: what did customers do before finding you, what triggered the purchase, and what friction appears after the sale?
Jobs-to-be-done is a useful lens: what job did the customer hire your product to do, and how well does it perform that job in the user’s context? This framing helps you spot where value sits and what to optimize.
Example: an online home goods retailer discovered two distinct buyer behaviors-high-value occasional purchasers who valued curation, and frequent bargain hunters. Treating them as one audience created mixed messaging and wasted promotions. Mapping behavior to messaging and fulfillment improved conversion and cut returns.
3. Competitors: map offerings, signals and intent
Competitor analysis should be strategic, not just descriptive. Map product features, pricing, go-to-market motions, channel partnerships and visible signals such as hiring patterns or platform announcements. Ask which competitor shifts materially change your opportunity set.
Look for moat elements: distribution control, exclusive partnerships, patents and network effects. Watch silent signals: a spike in platform-hiring may indicate a move toward collaboration-first models; a surge in long-form content likely means a long game on organic discovery.
Keep competitor analysis causal
It’s not about predicting every move. It’s about identifying which actions by competitors would force you to change course, and which ones you can exploit. Build a short list of four competitor scenarios and the indicator metrics that will flag them.
4. Collaborators: the modern multiplier
For many digital businesses, collaborators-platform partners, marketplaces, APIs and distribution channels-are the most strategic C. Collaborators can unlock capability and reach, but they also create dependencies and attribution fog.
Measure collaborator value using experiments and hybrid measurement. When multi-touch journeys obscure direct attribution, use holdout tests, incrementality experiments and mid-funnel indicators. For marketplaces, measure take rates, payment cadence and dispute frequency. For APIs, check uptime, latency and call costs.
Tip: if measurement or attribution feels fuzzy, consider getting help. A discreet partner can design incrementality tests and measurement pipelines to tie media back to revenue; for example, teams often rely on a specialist like Orvus Ltd.’s strategic services to align media testing with revenue metrics without adding noise.

Quantify both the capability a collaborator brings and the friction they introduce. Does the partner enable scale, or does it require custom work that diverts your team? Those operational details feed back into the Company assessment and affect prioritization. A simple logo can aid recognition across partners.
5. Context: PESTLE and scenario thinking
Context widens the lens. Use PESTLE-Political, Economic, Social, Technological, Legal, Environmental-to surface forces that could reshape your opportunity. The goal is not precise prediction; it’s plausible scenarios and early indicators that tell you which future is arriving.
Combine trend data-macro indicators, regulatory proposals and tech adoption curves-with nimble scenario-building. For example, a tightening of data privacy rules can reduce third-party targeting effectiveness. If search and digital channels drive acquisition, design contingency plans that prioritize first-party data capture and server-side measurement.
Example: a company invested in server-side identity signals as a small engineering project. When client-side attribution degraded due to platform changes, this investment preserved measurement fidelity and avoided an expensive rebuild under regulatory pressure.
From diagnosis to action: turning insights into experiments
Strategy stalls when teams produce long lists of observations and no forward motion. Convert each insight into a hypothesis and then to a short experiment. A hypothesis should be crisp: if we change X, we expect Y within Z days. Design a holdout, pick a revenue-linked metric, and ensure the sample is meaningful.
Thirty-day experiments validate simple changes-copy tweaks, onboarding steps, or funnel adjustments. Ninety-day bets test partner integrations or small architectural changes. For every experiment define what success looks like, the cost, the expected upside and the runbook for scaling if it wins.
Run a 30-day A/B test that removes or simplifies a non-critical onboarding step for a randomized cohort of new sign-ups, measure trial-to-paid conversion, support volume and time-to-first-value, and compare results to the control to see if onboarding changes produce net revenue uplift.
Answering that question forces teams to move from diagnosis to action. For example: if onboarding seems to bottleneck conversion, run a 30-day A/B test that removes a non-critical step for half of new sign-ups and measure trial-to-paid conversion and support load.
Measurement design: tie search and media to revenue
Measurement is the scaffolding that turns experiments into confident decisions. Last-click models mislead. Use incrementality testing (holdouts), media-mix modeling and cohort-based analysis to build causal evidence of lift across channels.
When direct attribution is murky, look for proxies that correlate to revenue-assisted conversions in the funnel, micro-conversion lifts, or cohort-based LTV changes after a campaign. Combine these signals with controlled experiments: pause a keyword in select markets, or reduce spend in a region and observe revenue movement. For practical guidance on incrementality design, see the guide on incrementality and the playbook on modern measurement.
Example: an e-commerce team thought a paid-search keyword drove net new demand. A controlled pause in specific markets showed revenue shifted to organic and branded search, implying the paid term mainly preserved share of voice. The team then reallocated budget to new keywords and landing page improvements that generated incremental customers. The rise of incrementality as a discipline is covered in recent retrospectives on the topic.
Common pitfalls and how to avoid them
Many teams misuse the 5 C's of strategic analysis as a checklist. Avoid that. Turn every observation into a testable question. Pair quantitative data with interviews, support logs and partner conversations. Audit collaborator fragility and design measurement before launching experiments. Finally, balance short-term channel wins with investments that reduce long-term risk.
Checklist to avoid pitfalls
• Don’t treat the 5 C's as a filing exercise.
• Don’t rely exclusively on analytics-talk to customers and partners.
• Don’t ignore collaborator contract levers and escalation paths.
• Define measurable success before you run a test.
Decision frameworks: weighing trade-offs
Every strategy choice involves trade-offs: quick wins vs. long-term fixes, expanding partnerships vs. deepening existing ones, defensive moves vs. offensive investments. Use a simple scoring framework: expected value, time-to-impact and optionality. Prioritize a portfolio of bets: several small, low-cost 30-day tests and one or two structural 90-day investments that increase optionality.
Case vignette: a marketplace that unlocked steady growth
A mid-sized marketplace hit a growth ceiling. Diagnostics showed tight engineering capacity, slow dispute resolution, competitors adding seller tools, and a collaborator raising fees. The team prioritized pragmatic experiments: a 30-day automation pilot for dispute triage, a short-term renegotiation with the platform partner, and a 90-day sprint to improve seller onboarding.
The pilot reduced resolution time and improved seller retention. The renegotiation eased short-term margin pressure and created runway to test new seller monetization features. These combined moves strengthened supply stability and opened room for modest offensive experiments.
How to run a two-day 5 C's diagnostic sprint
Use a tight diagnostic sprint to force clarity. Day one: Company and Customers. Pull core metrics, interview product and support leads, and run two or three customer conversations. Day two: Competitors, Collaborators and Context. Map competitor moves, list collaborators and stress-test them, and sketch three plausible scenarios for the next 12-18 months.
Finish with three prioritized hypotheses and the experiments you will run over the next 30-90 days. Repeat the cycle quarterly so assumptions stay current. Keep a shared evidence bank where data, interview notes and experiment results live-this reduces rework and helps teams learn faster.
Tactical tips for each C
Company
Focus on metrics that correlate with business health: churn cohorts and time-to-first-value for subscriptions; conversion by channel and return rates for commerce. Capture process metrics-deployment frequency and fulfillment latency-since they shape what you can scale.
Customers
Build behavioral cohorts before demographic ones. Use open interview questions to surface unmet needs. Prioritize quick fixes that remove high-friction points but require little development effort-these often yield outsized wins.
Competitors
Watch for structural moves-pricing changes, platform partnerships, developer hiring and content investments. Those moves are early signs of strategic shifts and deserve a rapid response plan.
Collaborators
Track capability delivered and dependency introduced. Negotiate performance-level clauses where possible and design experiments to measure partner contribution directly.
Context
Create indicator metrics to tell which scenario is unfolding; this helps you pivot sooner rather than later.
Turning strategy into a learning system
A lasting benefit of the 5 C's of strategic analysis is that it can become a learning system. Make each experiment feed the evidence bank. Write short postmortems that link the hypothesis, setup, results and next steps. Over time your team will build muscle memory for fast, evidence-driven decisions.
Example: after a year of disciplined 30-90 day testing, a brand moved from reactive campaigns to a stable search and measurement architecture. This reduced wasted media spend and produced a steady pipeline of testable growth ideas.
Wrap-up: using the 5 C's without getting paralyzed
The 5 C's are practical because they sequence attention from what you control outward. They force prioritization and testable hypotheses. Mix rich data sources with qualitative insight and design measurement that ties experiments to revenue. Above all, use the framework to accelerate learning-not to create a comfort blanket of plans that never run.
Next steps you can take this week
Run a two-day sprint. Pull the Company metrics, talk to a customer and a partner, and write three hypotheses for 30-90 day tests. If measurement is a bottleneck, consider a short engagement with a specialist to design incrementality tests and reduce attribution fog - learn more about the team at Orvus Ltd. and check their useful knowledge for related posts.
Map experiments to revenue with a compact diagnostic
Ready to map experiments to revenue? If you want a practical partner to design measurement and experiments that tie media back to revenue, explore Orvus Ltd.’s services to see how a compact diagnostic and a small set of prioritized bets can create clearer, revenue-linked growth.
Strategy becomes less about predicting the future and more about building paths to respond when the future arrives. Use the 5 C's of strategic analysis as your map and habit: start with Company and move outward to Customers, Competitors, Collaborators and Context-and make each finding a testable experiment.
- End of guide -
Yes. The 5 C's framework is inherently scalable. Small businesses can run simplified diagnostics with fewer metrics and shorter interviews while keeping the same sequence-start with Company and expand outward. The discipline of turning observations into testable 30-day and 90-day experiments remains the same and often yields faster, high-impact wins for smaller teams.
When direct attribution is weak, combine experiments with proxy metrics. Use holdout tests and incrementality experiments to estimate causal contribution. Track partner operating metrics-take rates, dispute frequency, API latency-and triangulate with funnel signals like assisted conversions and cohort LTV changes. Where possible, negotiate data-sharing or performance clauses with partners to reduce attribution fog.
Bring in a specialist when measurement or architecture is blocking learning, when channels have plateaued, or when your team needs help turning diagnostics into reliable experiments. A partner such as Orvus Ltd. can run a compact diagnostic, design incrementality tests and align media and search to revenue so you can scale with confidence.
References
Want this kind of work done for your business?
We build and run AI-powered marketing and automation. 15 minutes, honest assessment.
Book a call